Cup
with Handle Chart Pattern
by
Christopher Smith
Technically speaking, a cup with handle is a
rally to a new high, a decline of 20 -50 percent over 8 -12 weeks, a rally
falling just short of the new high level, a second decline of 8 - 20 percent
over 1 - 4 weeks followed by a breakout to fresh new highs on strong volume.
Why Does It Happen?
Like most technical patterns, the cup with
handle pattern is really little more than a variation of another technical
pattern. In this case that pattern is the double top. The pattern
begins after a well-liked stock rallies to a new high following a positive
fundamental development. As the stock surges investors feel increasingly
comfortable paying higher prices but there comes a point when the
"story" of the stock fails to convert new believers. Slowly,
the stock begins to drift lower as those seeking to lock-in profits outnumber
those intrigued by the story. Although most of the fundamental news is
still positive, many investors begin to question if the stock really is worth
the prevailing market price and over time a substantial decline begins.
This process creates an important technical
peak (top#1). As the stock nears a twenty percent decline from the
recent highs (this decline could reach fifty percent in bear markets) buyers
begin to reassert themselves and the stock stabilizes and a reaction low
occurs. From this point forward, the bias begins to tilt gradually
higher. During this phase the stock may be the subject of positive Wall
Street analyst comments, a new product announcement or legal victory. As
the rally gains steam sentiment improves dramatically and new buyers begin to
talk about certain new highs but those that purchased the stock at or near
top#1 get ready to sell. These investors may have been waiting as long
at 12 weeks for an opportunity to sell their positions without incurring a
loss and they are not dissuaded by all of the new found bullish talk.
Just short of the old highs at top#1 aggressive selling begins on no specific
news but in reality some investors that bought near top#1 have already begun
to sell. The stock begins to work significantly lower on increased
volume creating a second, well defined top (top#2).
This large U-shaped pattern may look like a
typical double top but for the purposes of this pattern, it is called the
cup. Noting key resistance at top#1 and top#2, speculators begin to
initiate short positions. From a technical perspective, this is a
very important part of the pattern. If the stock gains downside momentum
and volume continues to increase, this could very easily become a double top
but as the price works lower, volume slows, sellers seem to be losing the
upper hand. At this point more positive fundamental news is released and
the stock price rallies. With selling pressures satiated and the flow of
fundamental news decidedly bullish volume increases dramatically and the stock
works toward a fresh new high. This very small U-shaped pullback is
called the handle. Speculators become frantic, they must cover short positions
to cut losses but the supply of stock for sale has been significantly
curtailed because investors that bought at top#1 have liquidated
positions. The next session Wall Street analysts make positive comments
and the stock surges to a new high on dramatically increased volume.
Weeks later the stock trades at substantial new highs.
How Are Technical targets Derived?
The technical target for a cup with handle
pattern is derived by adding the height of the "cup" portion of the
pattern to the eventual breakout from the "handle" portion of the
pattern.
Cup and Handle Pattern for McDonalds
Corp. 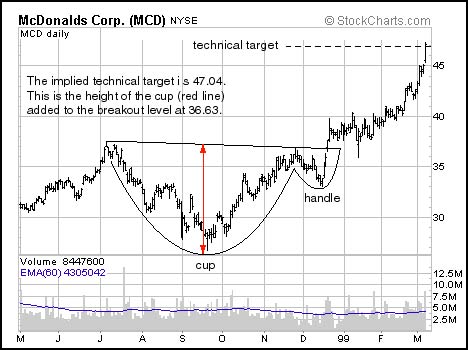
Vital Signs
-
Cup with handle patterns are very similar
to double top patterns with the exception being that selling does
accelerate after the formation of the second top, instead the stock
consolidates and eventually pushes beyond overhead resistance on strong
volume.
-
Generally, most cup with handle patterns
are completed over the course of 9 -16 weeks and involve two separate
pullbacks of 20 - 50 percent (cup portion) and 8 -20 percent (handle
portion).
-
Upside breakout from the handle portion of
the pattern should occur on strong volume. This increase in volume
verifies that selling pressures have been satiated.
-
Upside breakouts often lead to small
2-3% rallies followed by an immediate test of the breakout level. If
the stock closes below this level (now support) for any reason the pattern
becomes invalid.